The KPI Dashboard is used to visually understand transaction summary data for better business insights and to inform decisions.
The KPI Dashboard provides an executive-level blockchain transaction summary to easily view real-time revenue, expenses, and disputes across deployed smart contracts. This dashboard is configurable for each customer. Contact your Data Gumbo support representative to have customizations made to your KPI Dashboard.
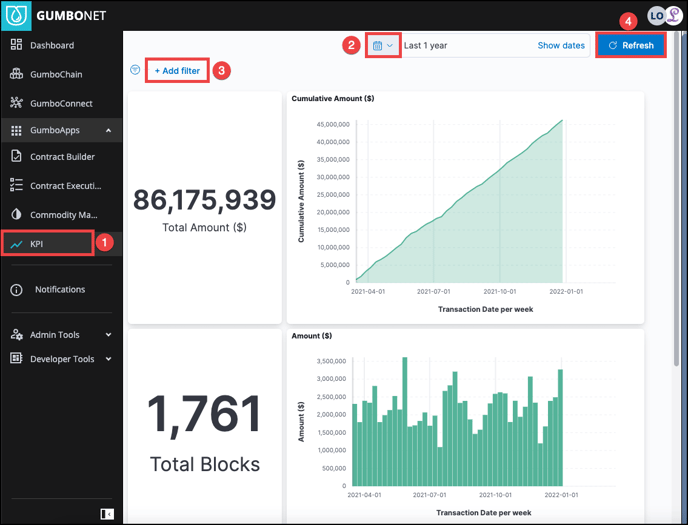
To Access the KPI Dashboard
-
Select KPI from the navigation bar menu
-
Click the calendar icon to select the time window
-
Click Add Filter to adjust the data displayed on your KPI dashboard
-
Click Refresh to update the KPI display
-
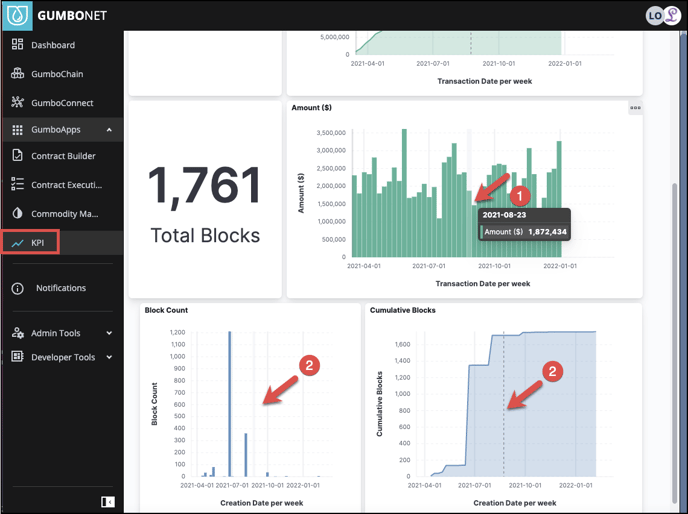
Hover your cursor over the tables and charts to view specific data.
-
The other charts will simultaneously indicate the coordinating time frame as your cursor in the current chart.